Culinary Cosmos
Mapping The Flavor Bible into a 3D High-Dimensional Knowledge Graph
Overview
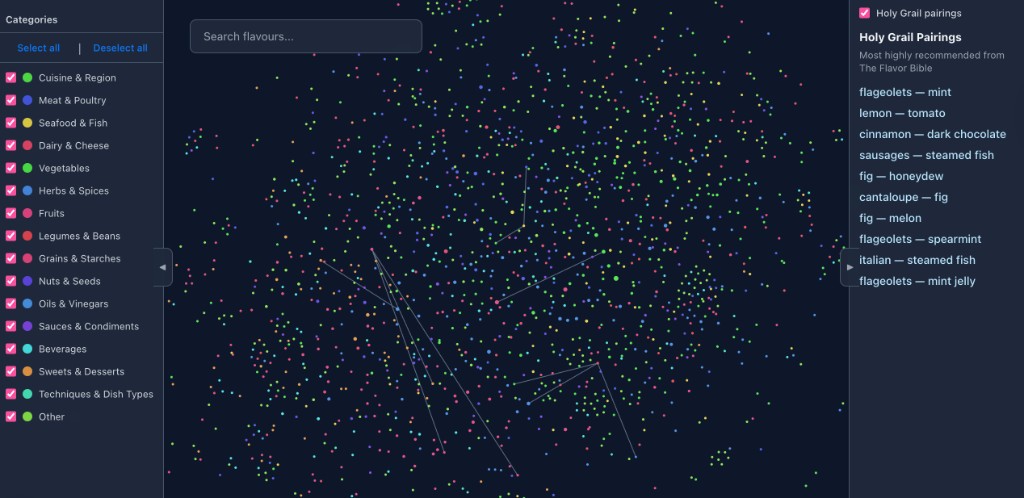
Traditional cookbooks are static, yet flavour pairing is a dynamic, multi-dimensional science. Built during the Composer Hackathon Vancouver, this project transforms the 900+ pages of culinary expertise in The Flavor Bible into an interactive, 3D “Galaxy.” By treating ingredients as nodes and their affinities as edges, we created a tool that allows chefs and home cooks to navigate flavour profiles through visual exploration rather than manual cross-referencing.
Data Engineering & Knowledge Extraction
The primary challenge was converting unstructured text from a 900-page reference book into a queryable graph format. We implemented a custom parsing pipeline to extract:
- Entities: Individual ingredients (2,000+ nodes).
- Affinities: The strength of pairings, represented by edge weights.
- Categories: Grouping ingredients into “constellations” based on food groups.
To refine the graph, we addressed Entity Resolution—ensuring that variations in naming (e.g., “Lemon Juice” vs. “Lemon”) were mapped correctly to maintain graph density and avoid fragmented nodes.
Technical Implementation
The project was built using a “human-in-the-loop” AI development workflow, leveraging Cursor Composer 1.5 to accelerate the transition from data script to live web application.
- Frontend: React-based architecture deployed on Vercel.
- Graph Engine: A high-performance 3D force-directed graph to handle thousands of real-time physics-based connections.
- UI/UX: A “Dark Matter” aesthetic where ingredient centrality is visually represented by node size and luminosity.
Reflection
As someone who bakes and cooks almost every day, this project was a bridge between my Masters in Data Science studies and my personal passions. It proved that complex datasets—when treated as an experience rather than a table—can unlock entirely new ways of interacting with information.
Credit
Collaborator: Built with Arnold Ying.